Fleet & Maintenance Tracer: real-time visibility into public space upkeep
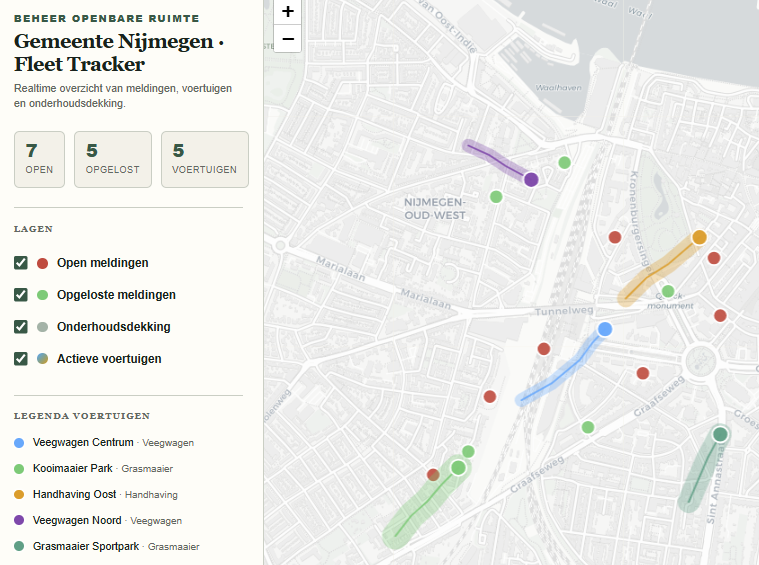
A serverless, interactive city map that shows at a glance what's already been mowed or swept, where vehicles are, and which reports are still open.
Context: Municipal organisation, public space management
A municipality had no up-to-date view of which streets and zones had already been mowed, swept or maintained, or where vehicles physically were. Status and progress mostly lived in people's heads and scattered reports.
Showing real-time positions and high coverage without immediately investing in expensive GIS software or heavy API infrastructure was the core of the assignment.
A serverless, interactive city map showing work areas as buffer zones around a route, with reports layered directly on top — no heavy backend required, yet immediately usable visually.
The first version was a client-side dashboard built on HTML and Leaflet, fed with mock JSON data for routes and reports, so the concept could be visually tested before a real data source connection was needed.
For the first time there was direct visual proof of coverage — what's mowed, what's swept — and of report status, without a separate reporting step afterwards.
A simple visual work radius — a circular buffer around a route — turned out to be far more intuitive for users than more complex heatmaps. Understandability beat precision.
A live IoT/GPS feed straight from the vehicles, and automated routing of reports to the right field-service employee, are the obvious next steps.
Recognise this kind of challenge?
We're happy to think along, from the very first idea to a working first version.
Other cases
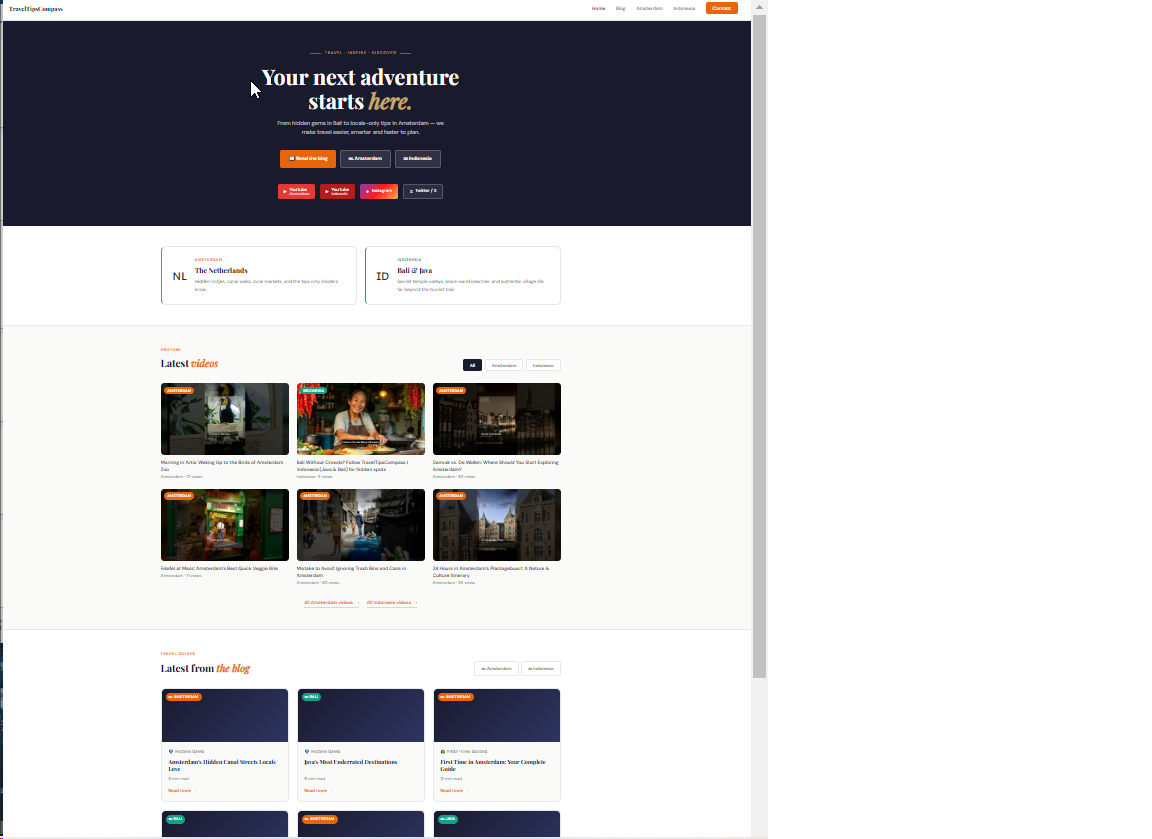
A content engine for TravelTipsCompass: from time-consuming juggling to automatic publishing
An agent that works from a content calendar, collaborates with the team, and ultimately prepares and publishes photos and posts across multiple channels on its own.
Read the case →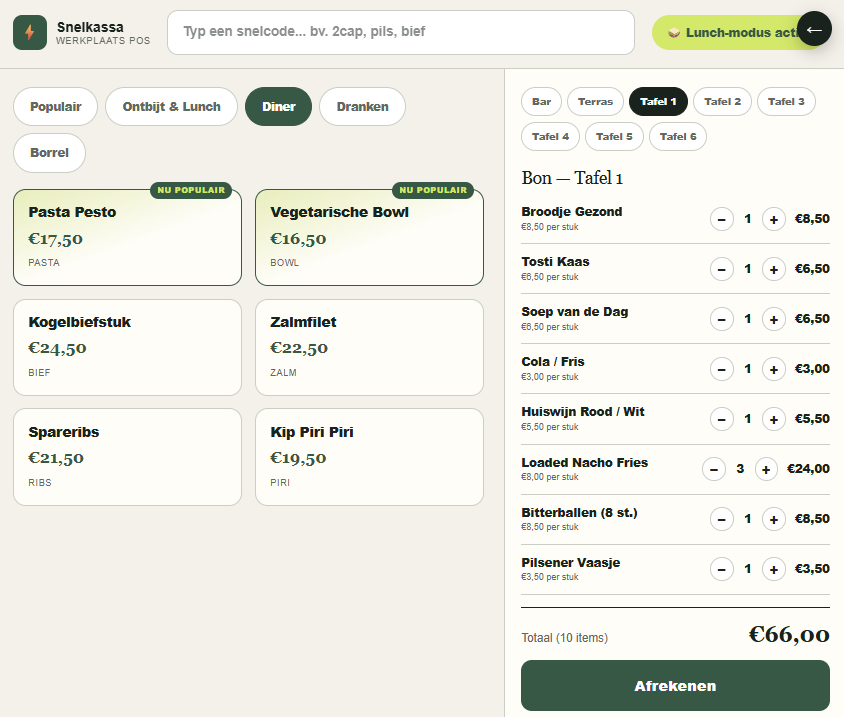
Context-Aware POS: from 6 clicks to 1 tap during peak hours
A point-of-sale system that adapts to time of day and context, so ordering during a rush no longer feels like clicking through a complicated menu.
Read the case →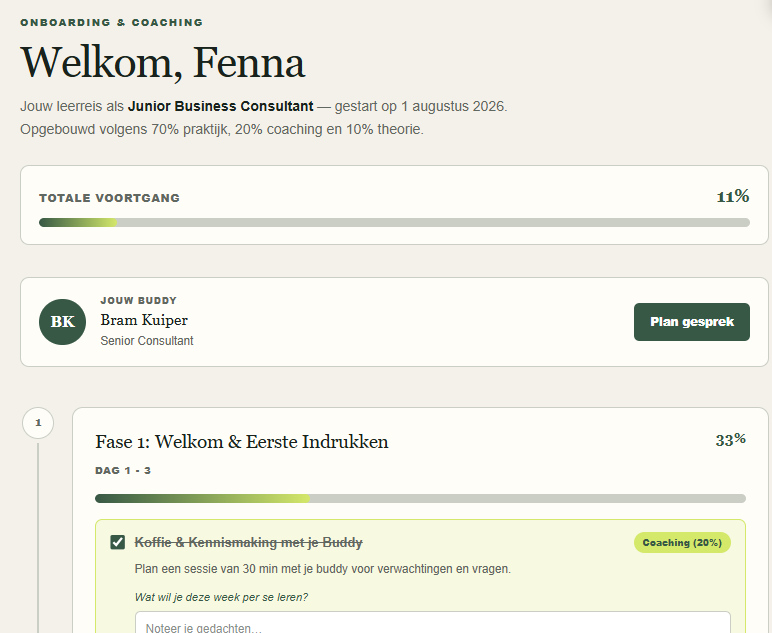
Learning & Onboarding Hub: from information overload to a manageable learning journey
A visual learning journey with microlearning and a direct buddy pairing, onboarding new employees step by step with visible progress.
Read the case →